Draw a stacked composition barplot at a selected taxonomic rank.
Usage
plot_composition(
  object,
  taxonomic_rank = c("Kingdom", "Phylum", "Class", "Order", "Family", "Genus", "Species"),
  top_n = 10,
  x = "sample_id",
  relative = TRUE,
  facet_by = NULL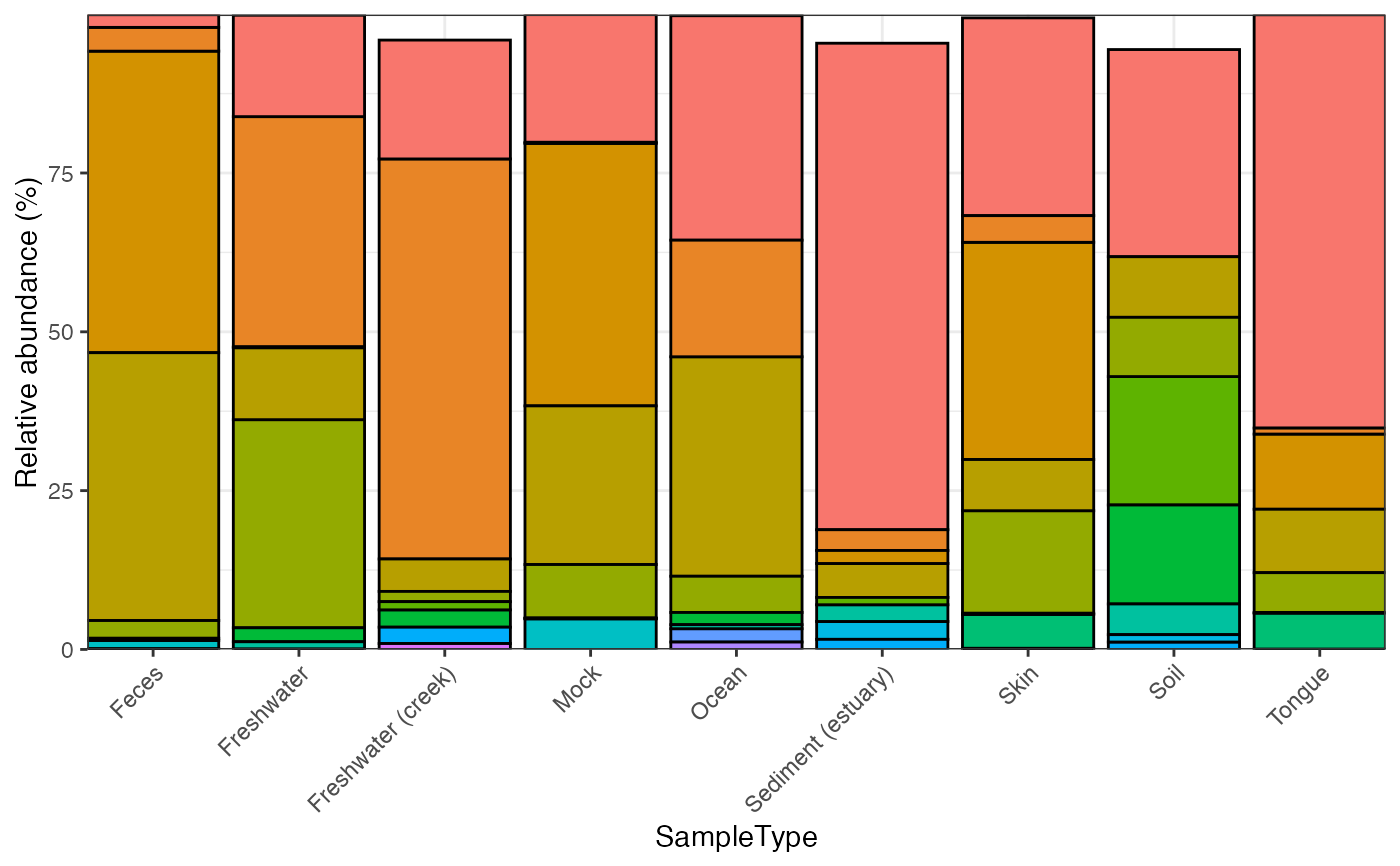
)Examples
data("global_patterns", package = "microbiomedataset")

plot_composition(
  object = global_patterns,
  taxonomic_rank = "Phylum",
  top_n = 8,
  x = "SampleType"
)