Microbiome Visualization
Xiaotao Shen xiaotao.shen@outlook.com
2026-03-04
Source:vignettes/visualization_microbiome.Rmd
visualization_microbiome.RmdThis article focuses on visualization methods that directly consume a
microbiome_dataset. These functions cover the plots that
are routinely used for abundance summaries, diversity, ordination, and
phylogenetic context.
library(microbiomedataset)
data("global_patterns", package = "microbiomedataset")
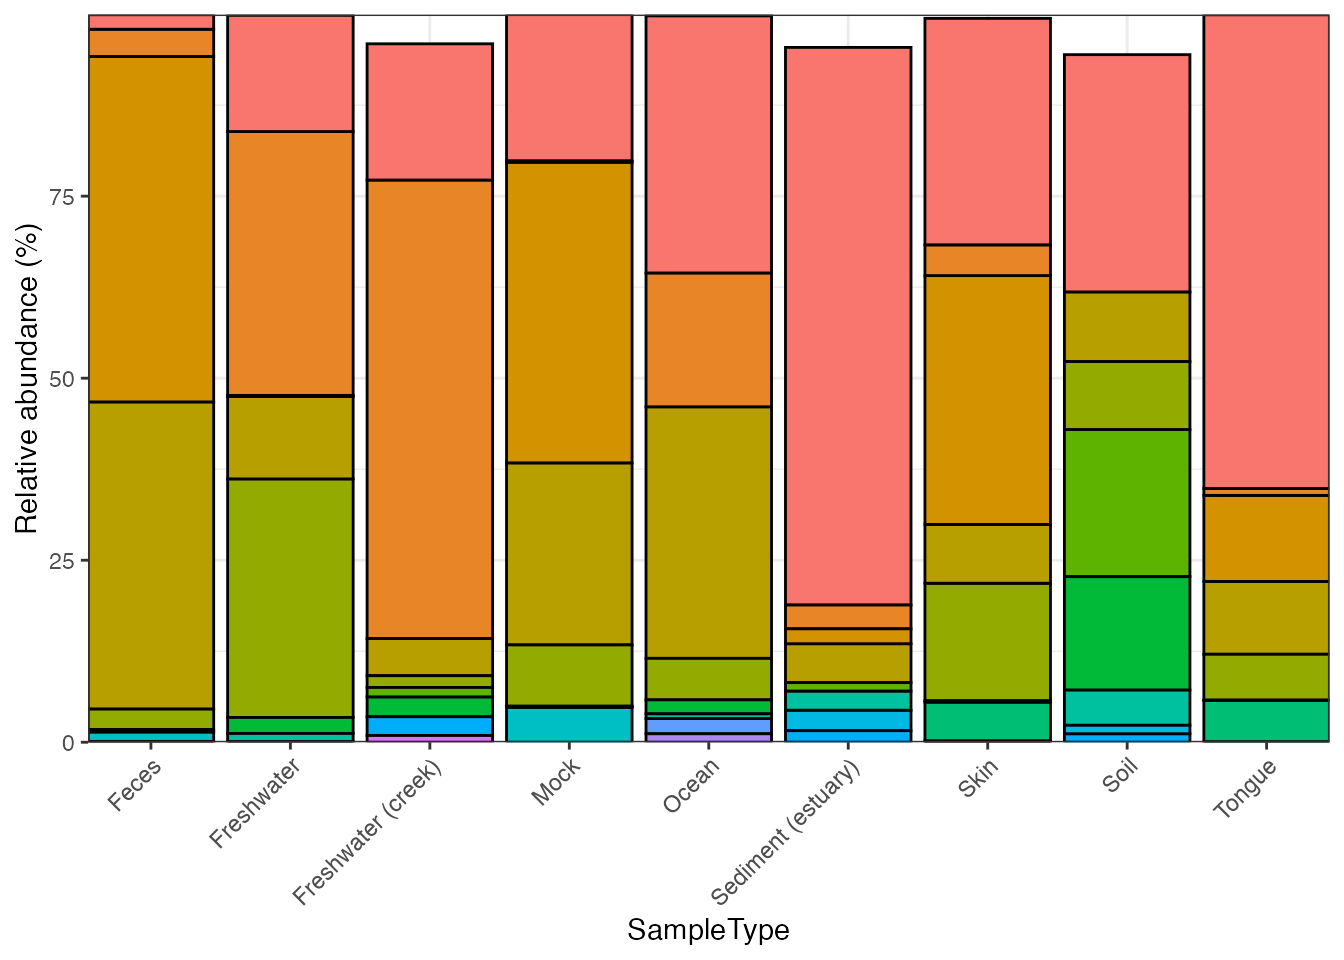
object <- global_patternsComposition and abundance
plot_composition(
  object = object,
  taxonomic_rank = "Phylum",
  top_n = 8,
  x = "SampleType"
)
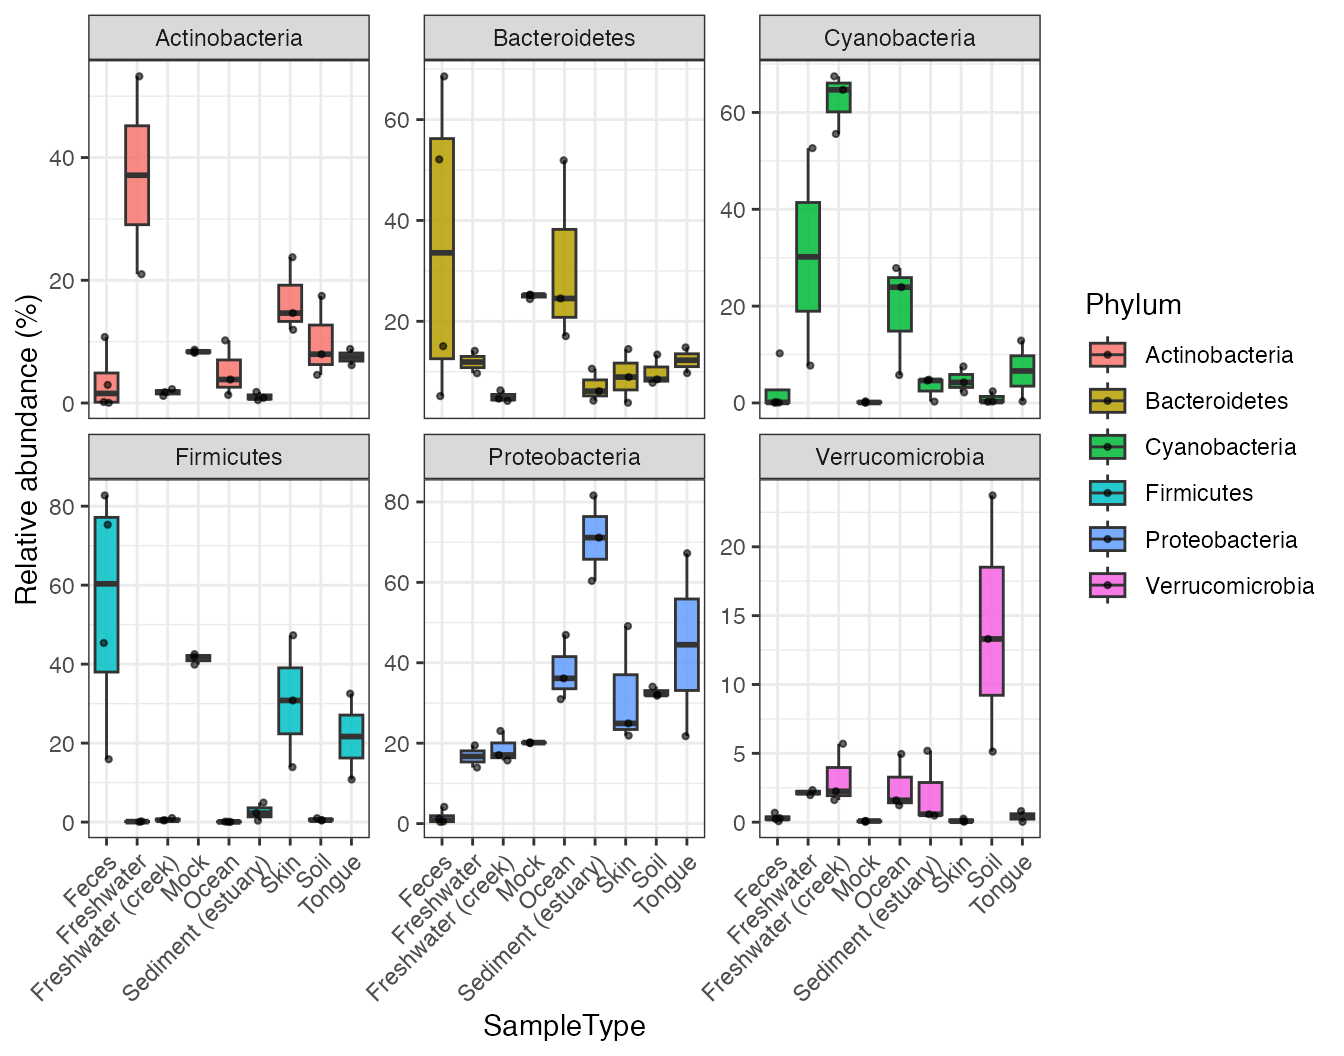
plot_abundance(
  object = object,
  taxonomic_rank = "Phylum",
  x = "SampleType",
  top_n = 6
)
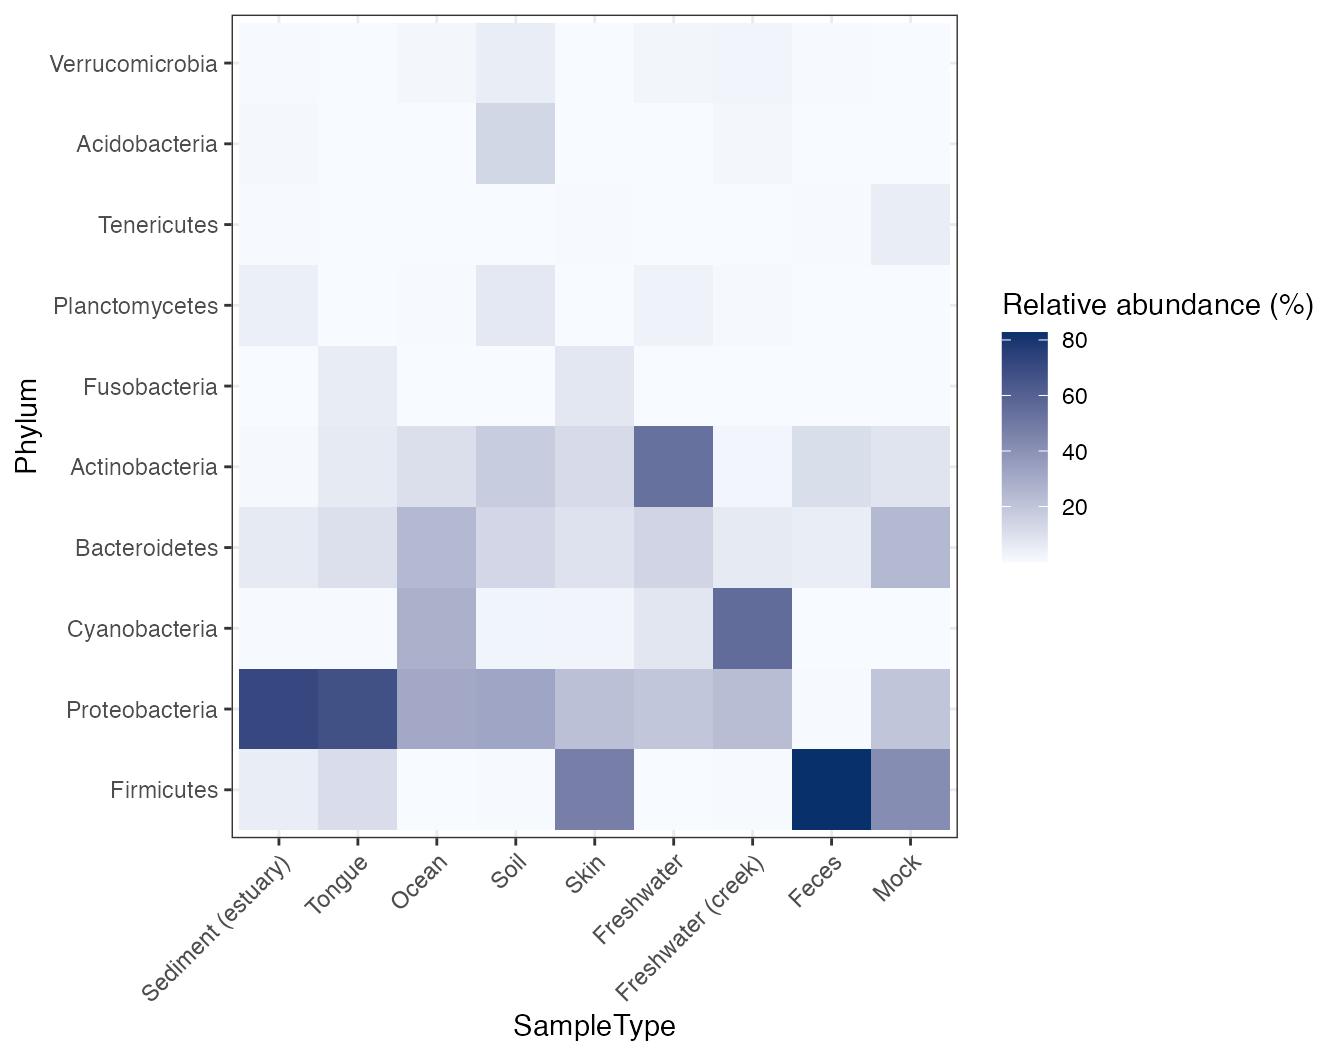
Heatmap, prevalence, and sample depth
plot_heatmap(
  object = object,
  taxonomic_rank = "Phylum",
  top_n = 10,
  sample_label = "SampleType"
)
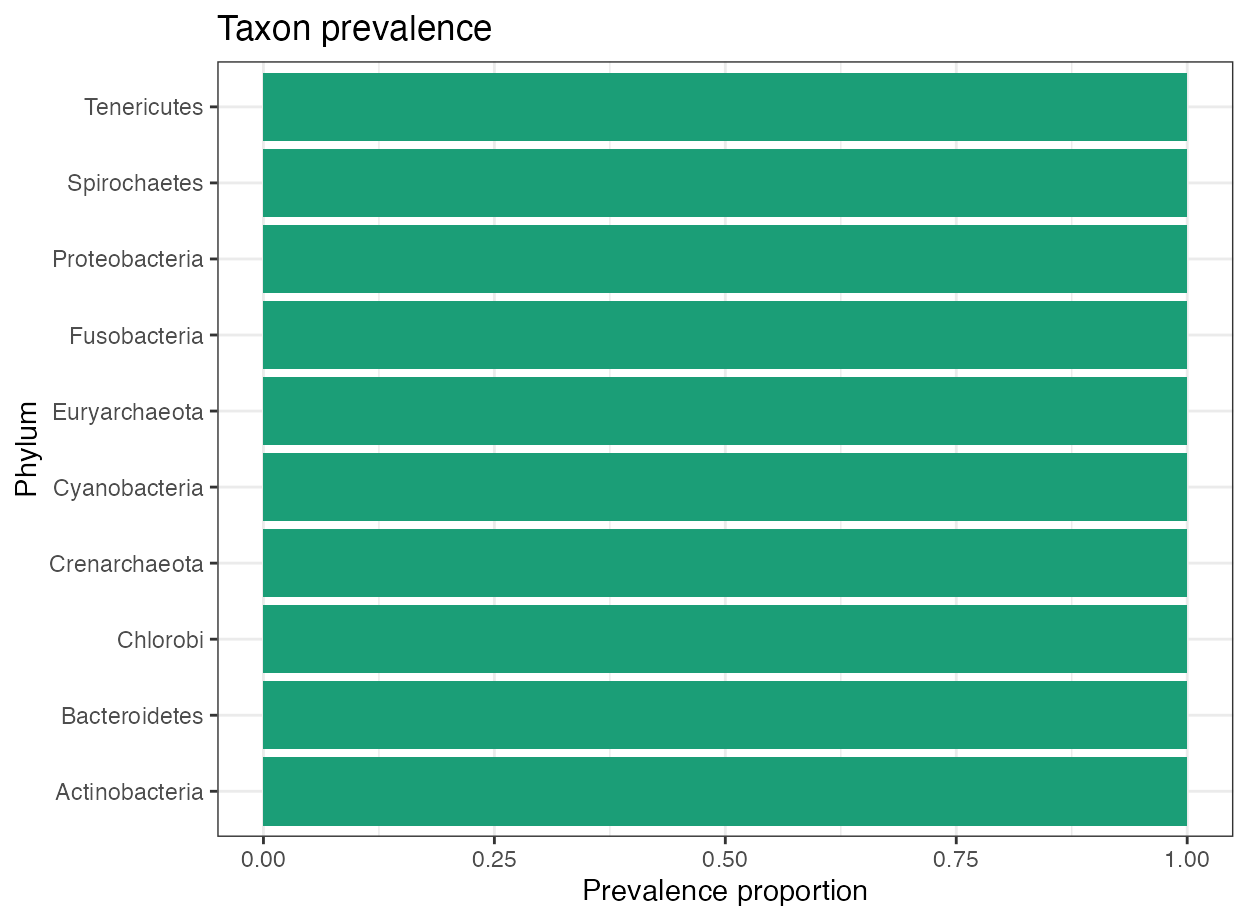
plot_prevalence(
  object = object,
  taxonomic_rank = "Phylum",
  top_n = 10
)
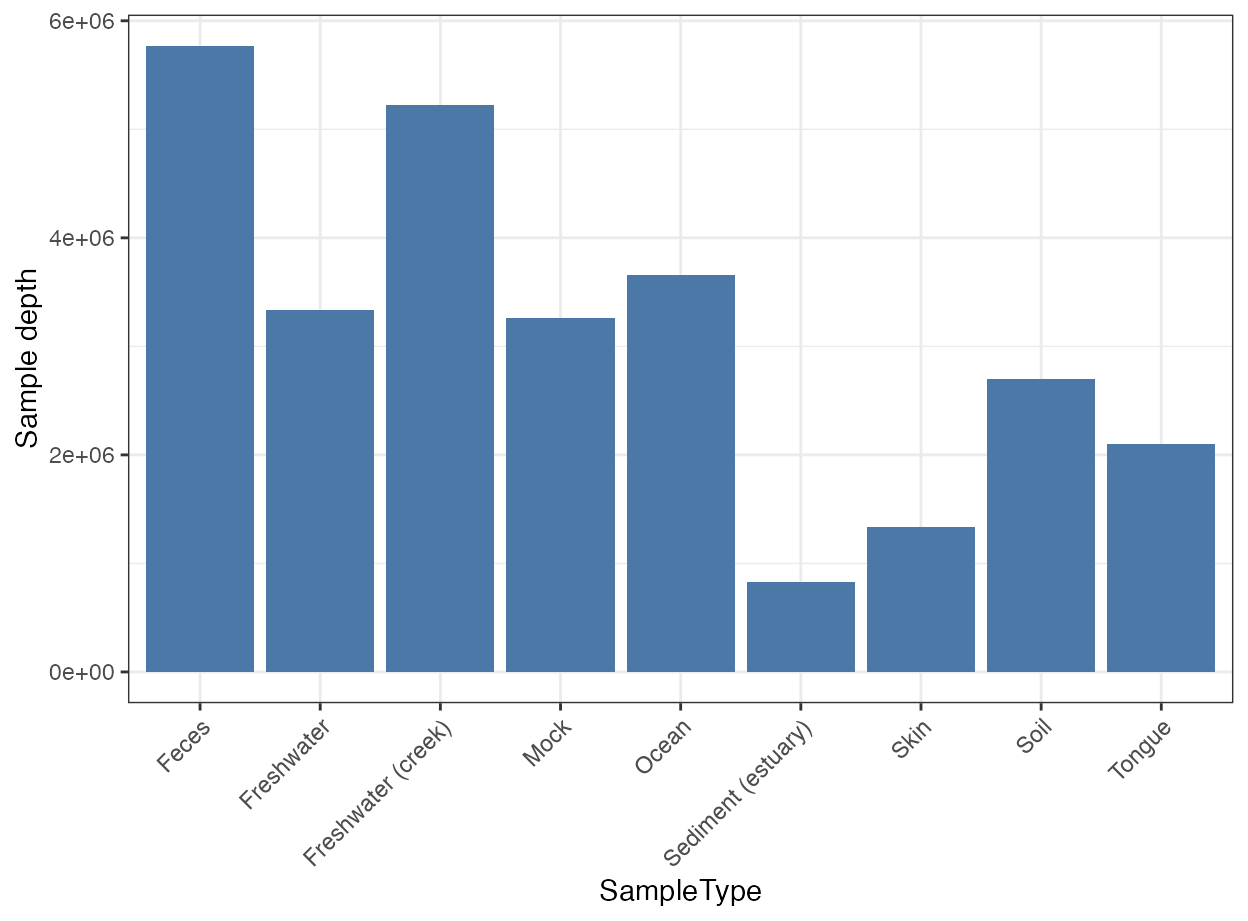
plot_sample_depth(
  object = object,
  x = "SampleType"
)
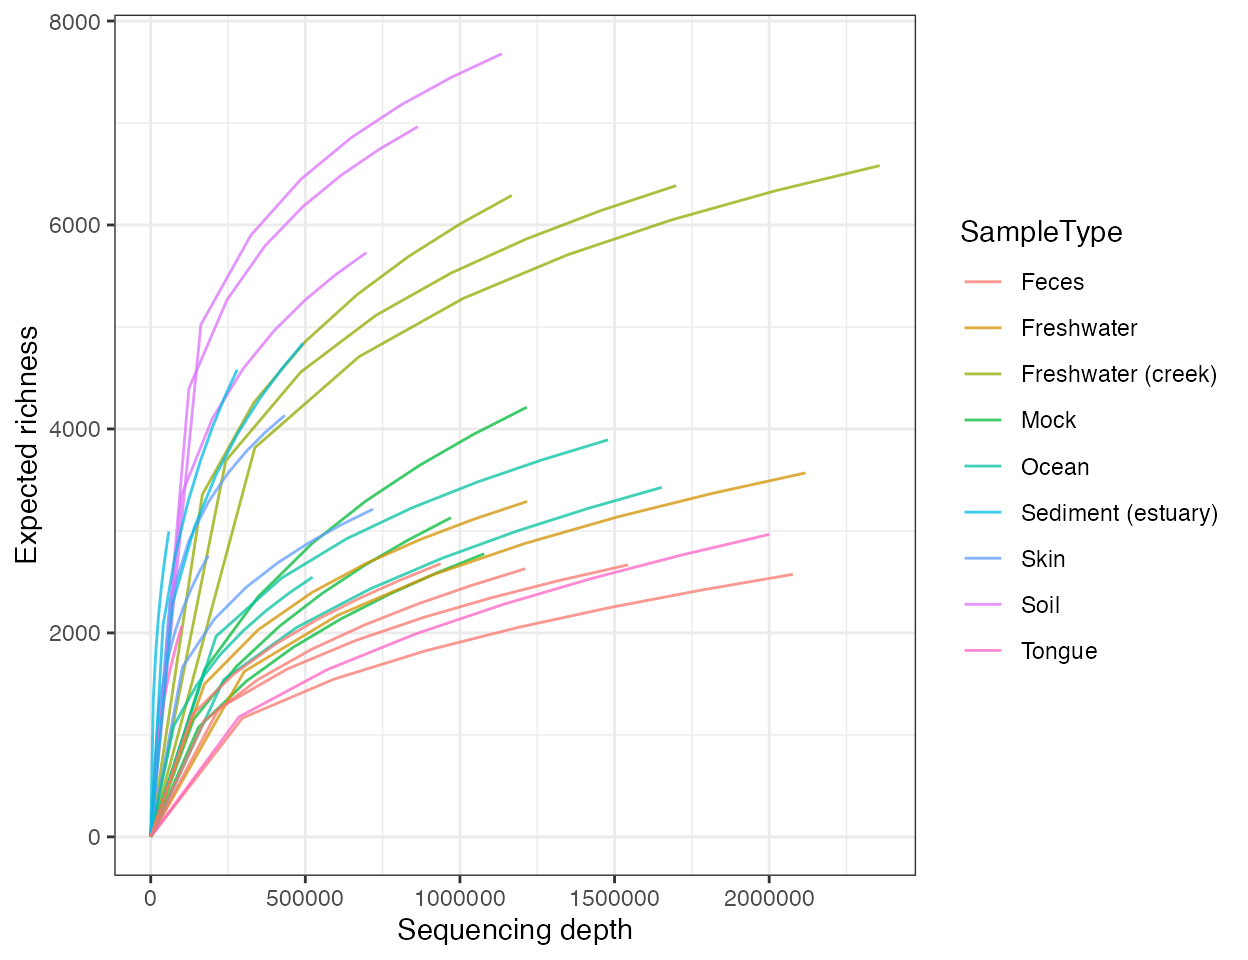
plot_rarefaction(
  object = object,
  steps = 8,
  color_by = "SampleType"
)
Diversity and ordination
alpha_result <- calculate_alpha_diversity(object, metric = "shannon")
plot_alpha_diversity(alpha_result, x = "SampleType")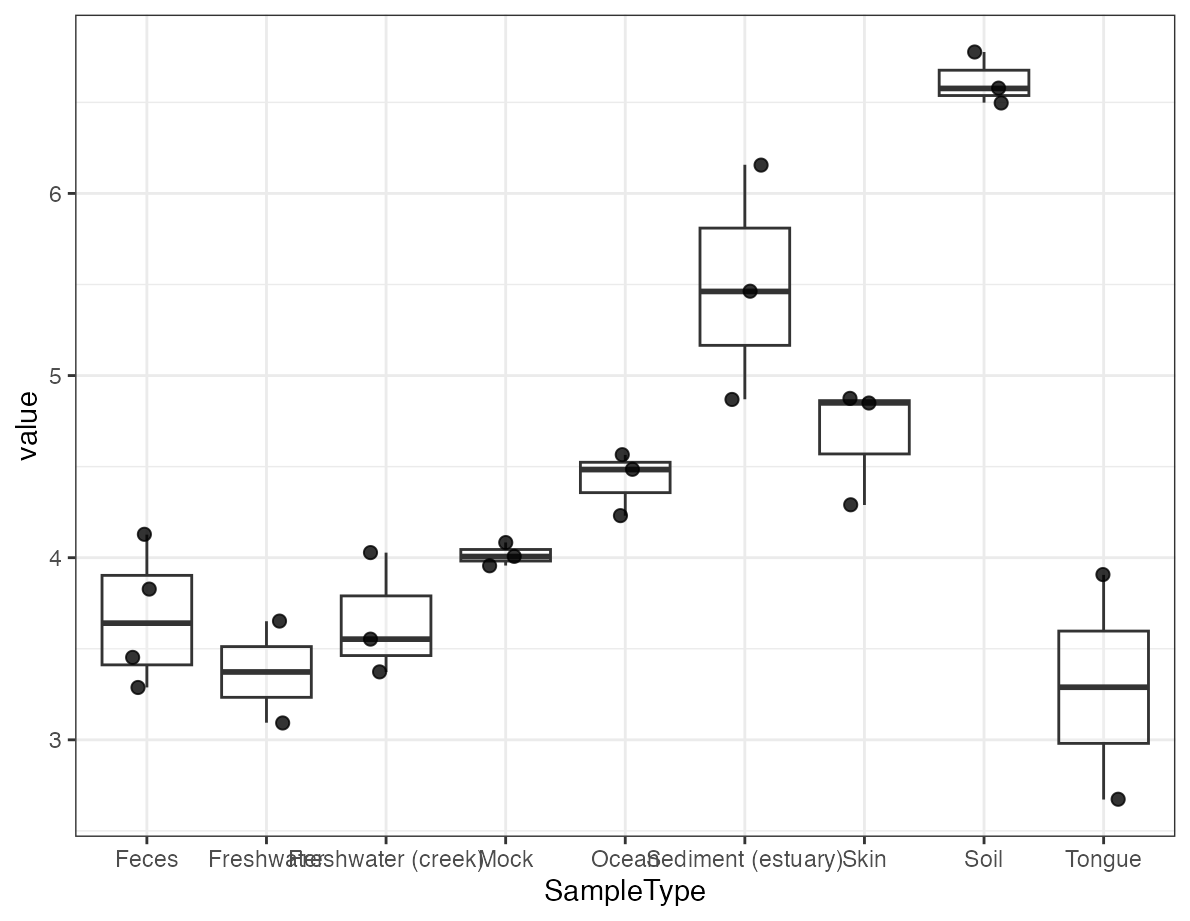
ordination_result <- run_ordination(object, method = "PCoA")
plot_ordination(ordination_result, color_by = "SampleType")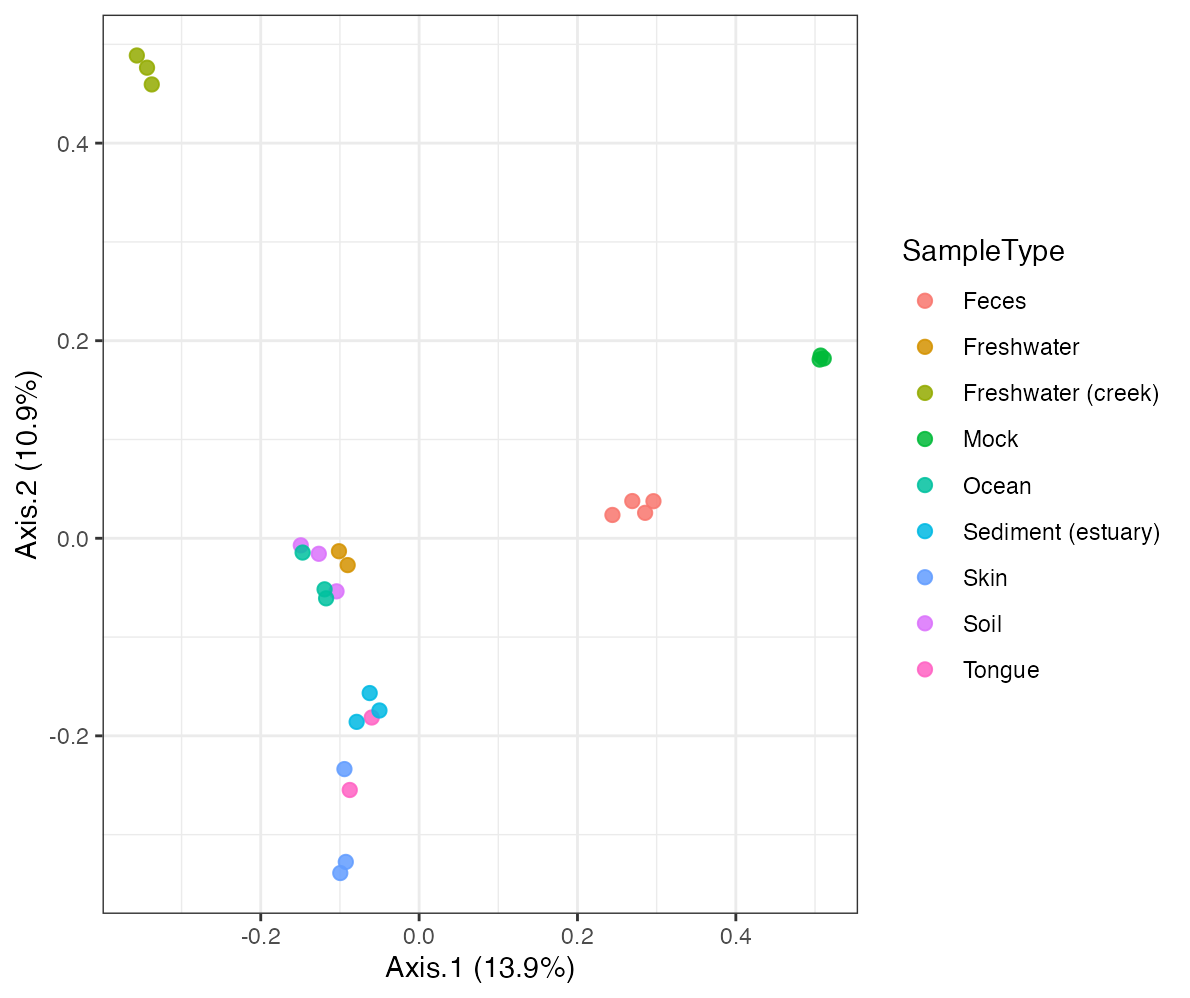
Trees
tree_object <- align_tree(object, tree = "taxa_tree")
plot_tree(tree_object, tree = "taxa_tree")
plot_tree_link(tree_object, tree = "taxa_tree")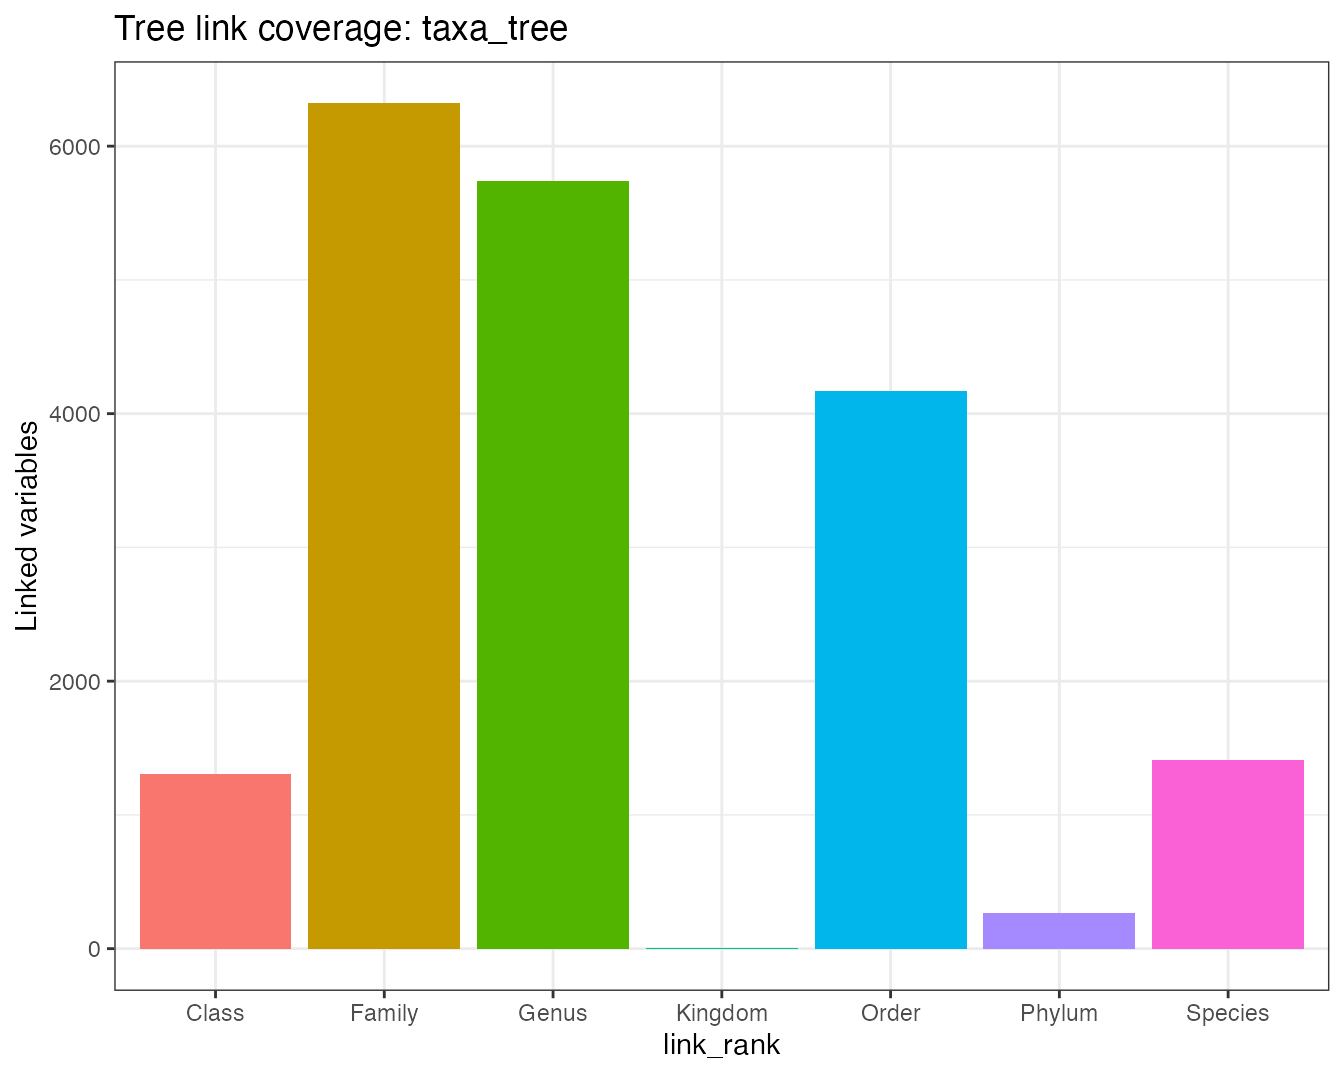
The same microbiome_dataset object can now drive most of
the standard microbiome figures directly, without converting into
another plotting-specific container first. For interactive trees,
pathway-level displays, and mixed-effect result views, see the advanced
visualization article.