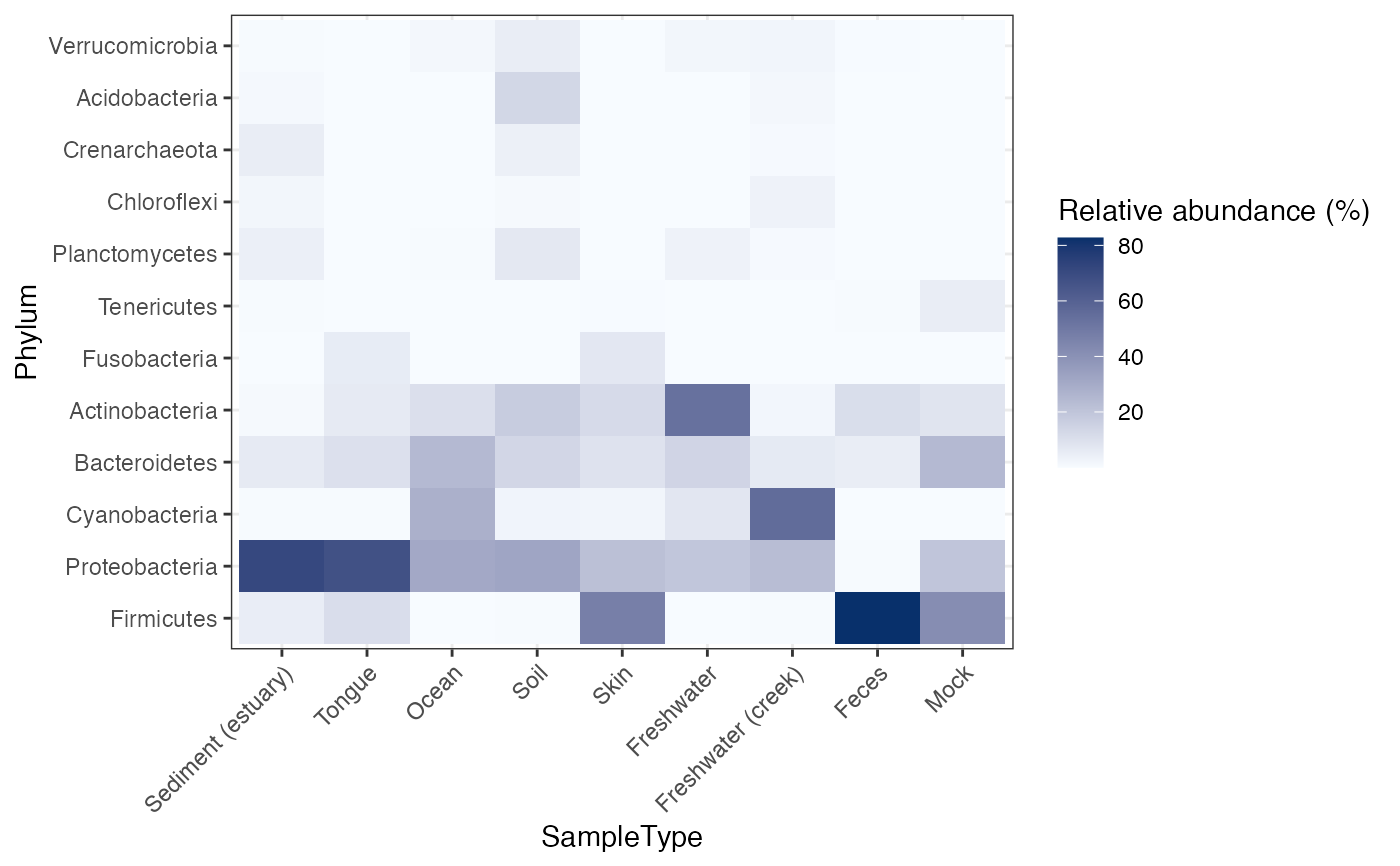
Draw a heatmap of dominant taxa across samples.
Usage
plot_heatmap(
  object,
  taxonomic_rank = c("Kingdom", "Phylum", "Class", "Order", "Family", "Genus", "Species"),
  top_n = 20,
  relative = TRUE,
  cluster_samples = TRUE,
  cluster_taxa = TRUE,
  sample_label = "sample_id"
)
Arguments
- object
A
microbiome_datasetobject.- taxonomic_rank
Taxonomic rank used for aggregation.
- top_n
Number of taxa displayed.
- relative
Whether to use relative abundance.
- cluster_samples
Whether to cluster samples.
- cluster_taxa
Whether to cluster taxa.
- sample_label
Sample metadata column shown on the x axis.
Examples
data("global_patterns", package = "microbiomedataset")

plot_heatmap(
  object = global_patterns,
  taxonomic_rank = "Phylum",
  top_n = 12,
  sample_label = "SampleType"
)