R/plot_microbiome_visualization.R
plot_sample_depth.Rd
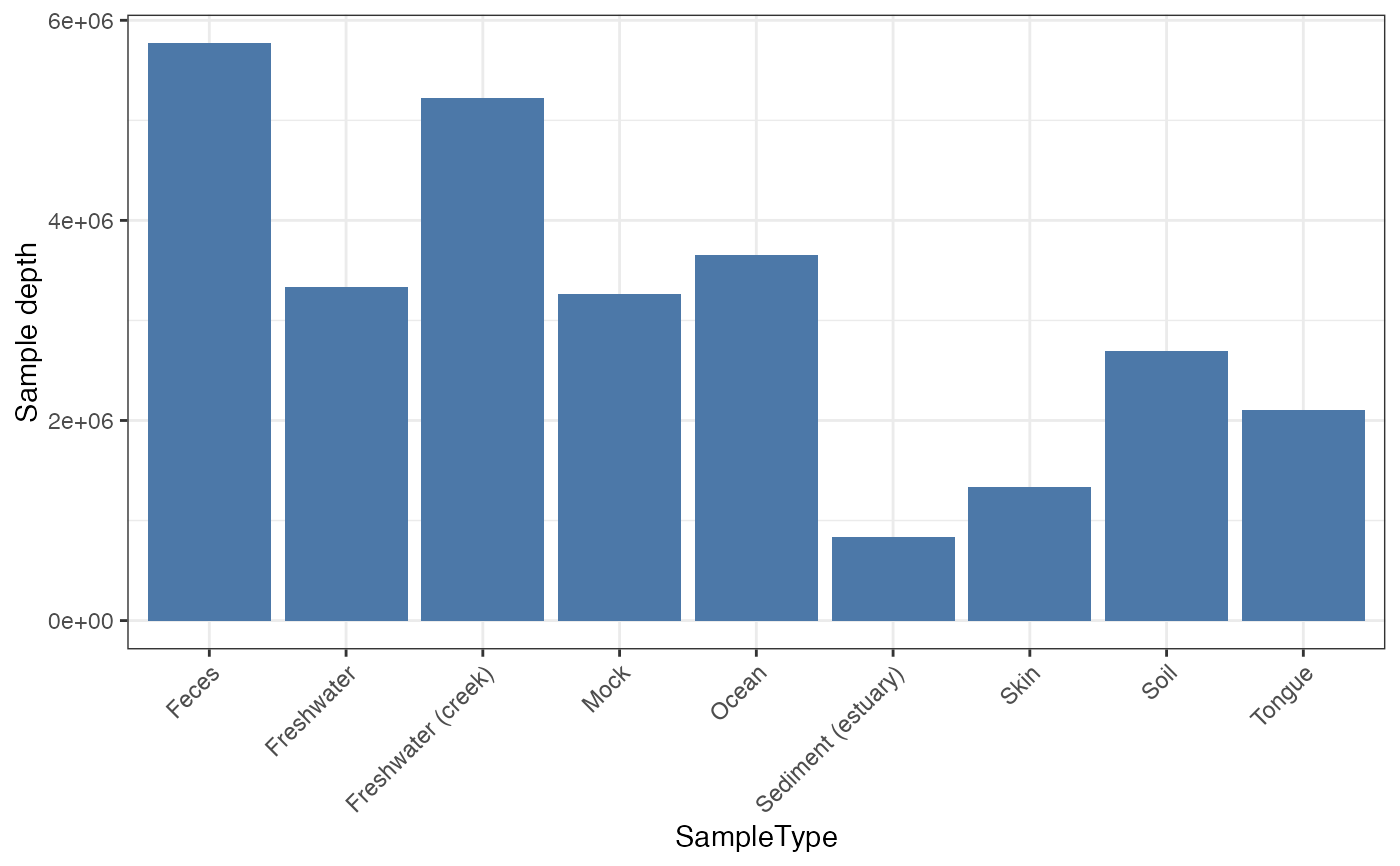
Draw sequencing depth per sample.
plot_sample_depth(object, x = "sample_id", geom = c("bar", "point"))
A microbiome_dataset object.
microbiome_dataset
Sample metadata column shown on the x axis.
Geometry used to display depth.
A ggplot object.
ggplot
data("global_patterns", package = "microbiomedataset")

plot_sample_depth(global_patterns, x = "SampleType")