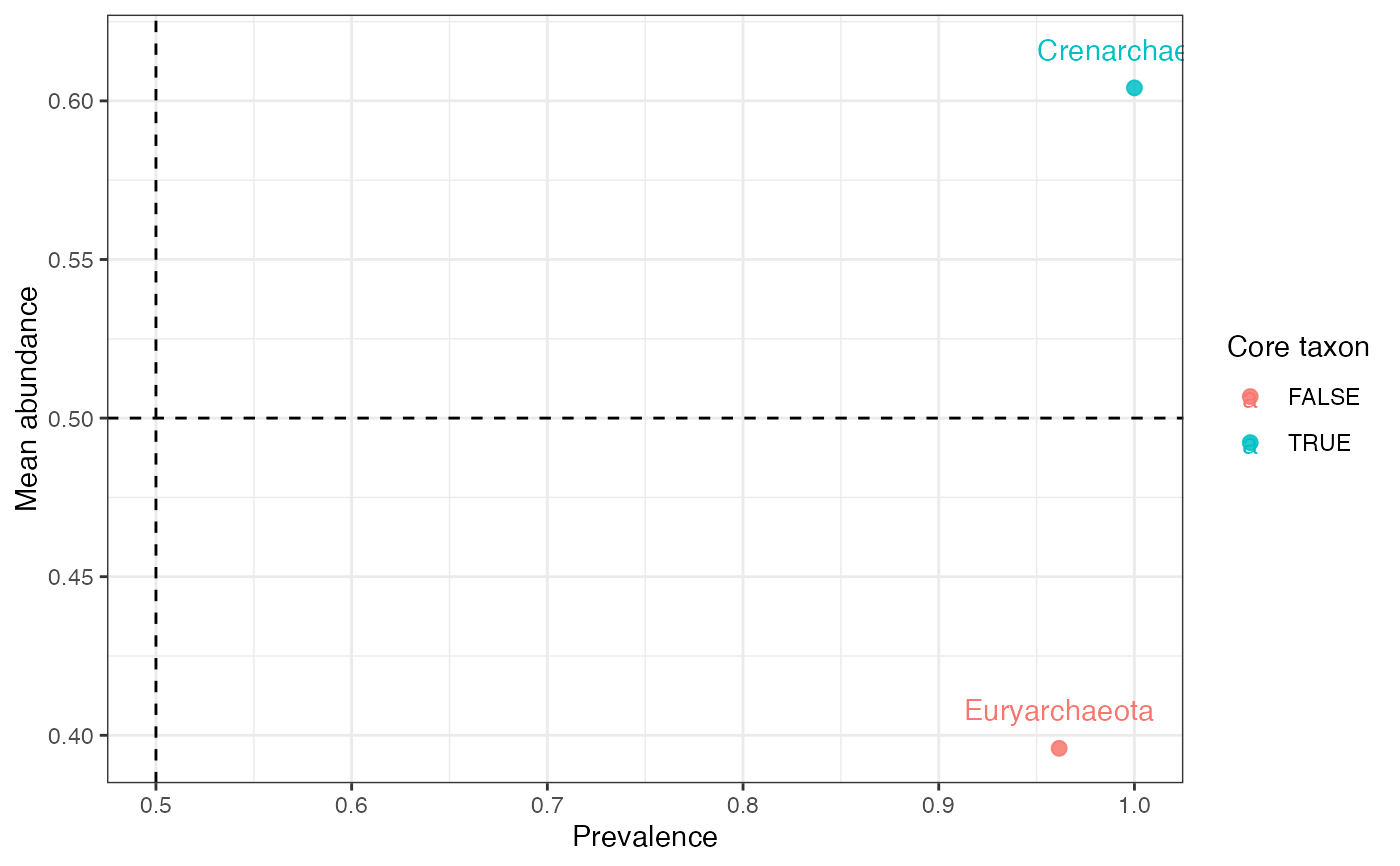
Highlight taxa that satisfy prevalence and abundance thresholds.
Usage
plot_core_taxa(
  object,
  taxonomic_rank = c("Kingdom", "Phylum", "Class", "Order", "Family", "Genus", "Species"),
  detection = 0,
  prevalence_cutoff = 0.5,
  abundance_cutoff = NULL,
  relative = TRUE,
  top_n = 20
)
Arguments
- object
A
microbiome_datasetobject.- taxonomic_rank
Taxonomic rank used for aggregation.
- detection
Detection threshold used for prevalence.
- prevalence_cutoff
Core prevalence cutoff.
- abundance_cutoff
Core mean abundance cutoff.
- relative
Whether to use relative abundance.
- top_n
Number of taxa displayed.
Examples
data("global_patterns", package = "microbiomedataset")
x <- prune_taxa(global_patterns, variable_id = global_patterns@variable_info$variable_id[1:200])
plot_core_taxa(x, taxonomic_rank = "Phylum", top_n = 8)