Plot a Heatmap with Metadata Annotations
Source:R/plot_microbiome_visualization_extended.R
plot_heatmap_annotation.RdDraw a ComplexHeatmap object with optional sample and taxa annotations.
Usage
plot_heatmap_annotation(
  object,
  taxonomic_rank = c("Kingdom", "Phylum", "Class", "Order", "Family", "Genus", "Species"),
  top_n = 20,
  relative = TRUE,
  sample_annotation = NULL,
  taxa_annotation = NULL
)Value
A ComplexHeatmap::Heatmap object.
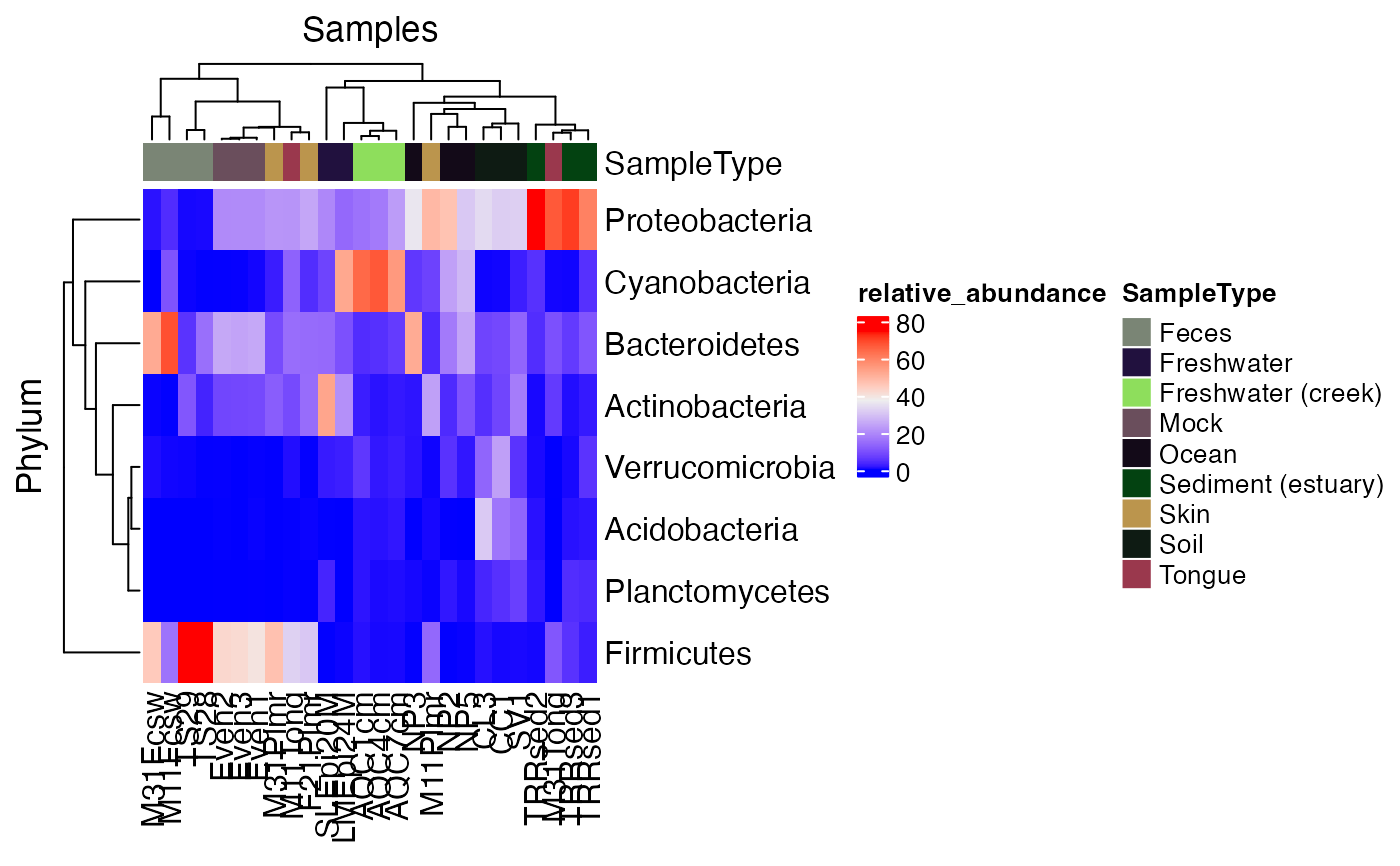
Examples
data("global_patterns", package = "microbiomedataset")
plot_heatmap_annotation(
  global_patterns,
  taxonomic_rank = "Phylum",
  top_n = 8,
  sample_annotation = "SampleType"
)