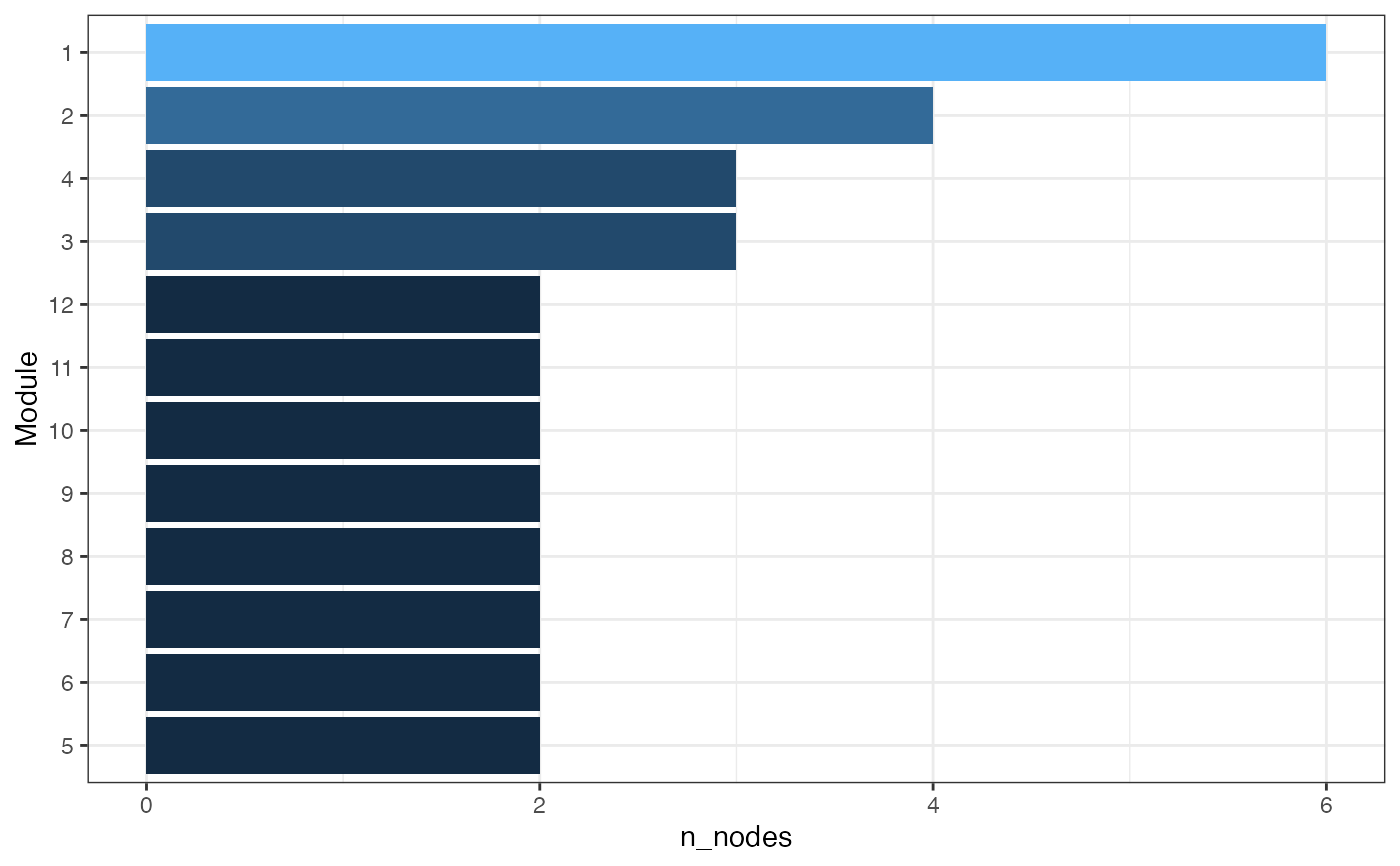
Summarize module sizes and block composition as a bar chart.
Arguments
- object
A
microbe_metabolite_networkobject or a module summary table produced bysummarise_network_modules().- method
Community detection method used when
objectis a network.- value
Summary metric displayed on the x-axis.
- top_n
Maximum number of modules shown.
Examples
data("demo_crossomics", package = "microbiomedataset")

correlation <- calculate_correlation(
  microbiome_data = demo_crossomics$microbiome_data,
  metabolome_data = demo_crossomics$metabolome_data,
  sample_link = demo_crossomics$sample_link,
  microbiome_rank = "Genus",
  metabolome_transform = "none"
)
network <- build_correlation_network(
  correlation,
  min_abs_correlation = 0.2,
  max_q_value = 1,
  top_n = 20
)
plot_module_summary(network)