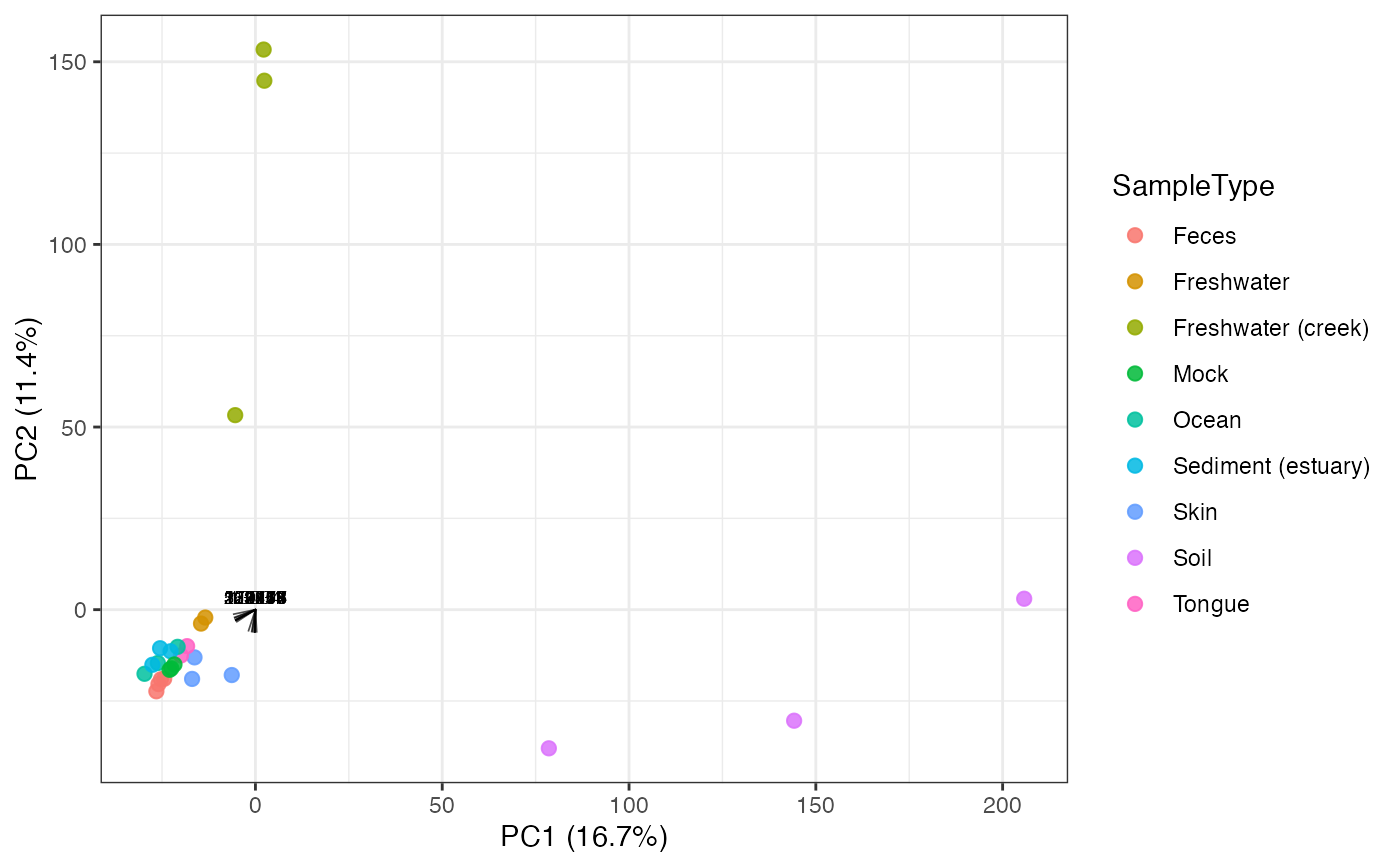
Plot an Ordination Biplot
Source:R/plot_microbiome_visualization_extended.R
plot_ordination_biplot.RdDraw an ordination plot with feature loadings.
Arguments
- object
A
microbiome_ordinationormicrobiome_datasetobject.- method
Ordination method used when
objectis a dataset.- distance_method
Distance method used when computing PCoA.
- x, y
Axis names. Defaults to the first two axes.
- color_by
Optional sample metadata column.
- shape_by
Optional sample metadata column.
- top_n_loading
Number of feature loadings retained.
- loading_scale
Multiplier applied to feature loading vectors.
Examples
data("global_patterns", package = "microbiomedataset")
plot_ordination_biplot(global_patterns, method = "PCA", color_by = "SampleType")