Plot Taxa Overlap Between Groups
Source:R/plot_microbiome_visualization_extended.R
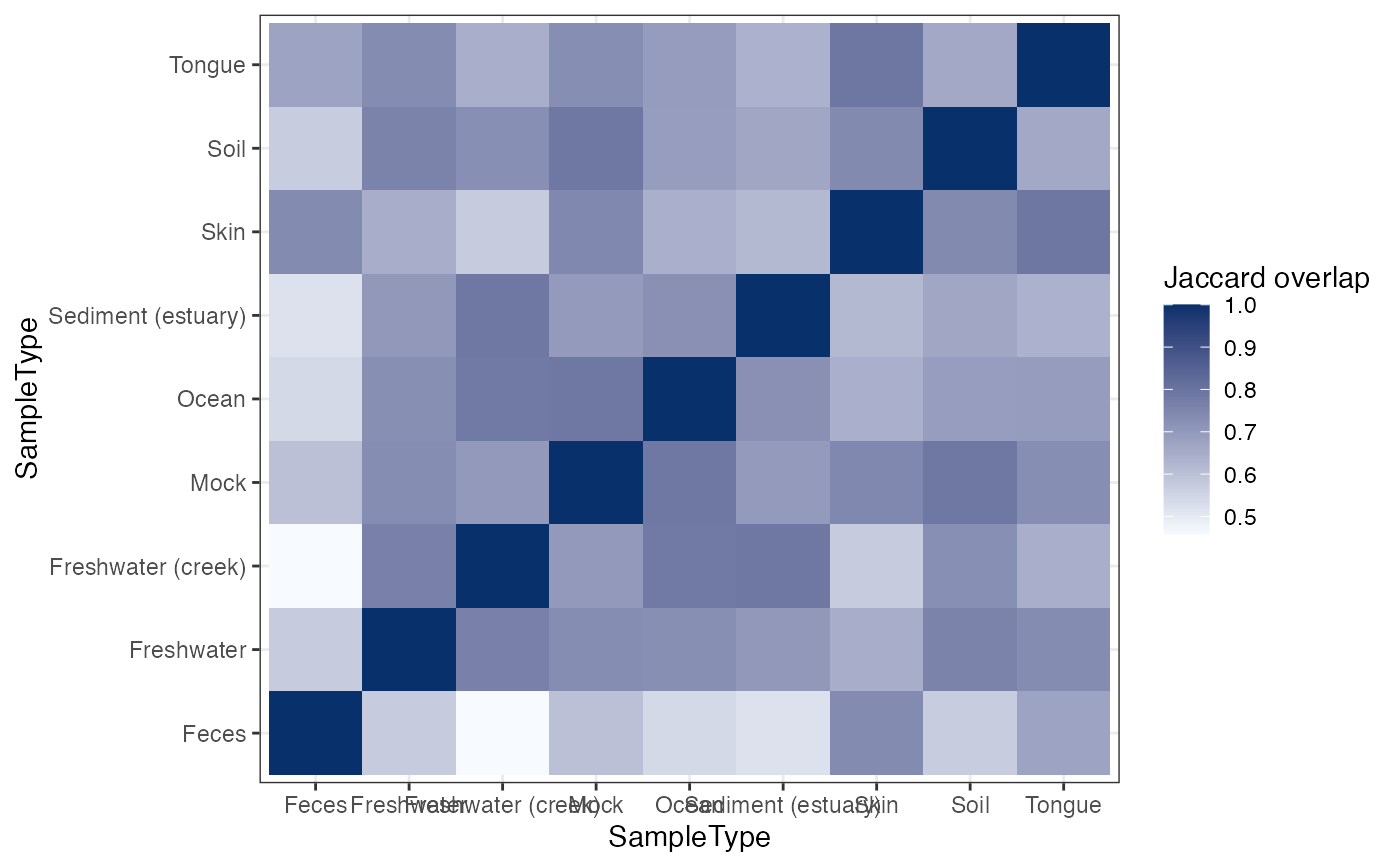
plot_taxa_overlap.RdVisualize pairwise group overlap in prevalent taxa.
Usage
plot_taxa_overlap(
  object,
  group_by,
  taxonomic_rank = c("Kingdom", "Phylum", "Class", "Order", "Family", "Genus", "Species"),
  prevalence_cutoff = 0.3,
  relative = TRUE
)Examples
data("global_patterns", package = "microbiomedataset")
plot_taxa_overlap(global_patterns, group_by = "SampleType", taxonomic_rank = "Phylum")