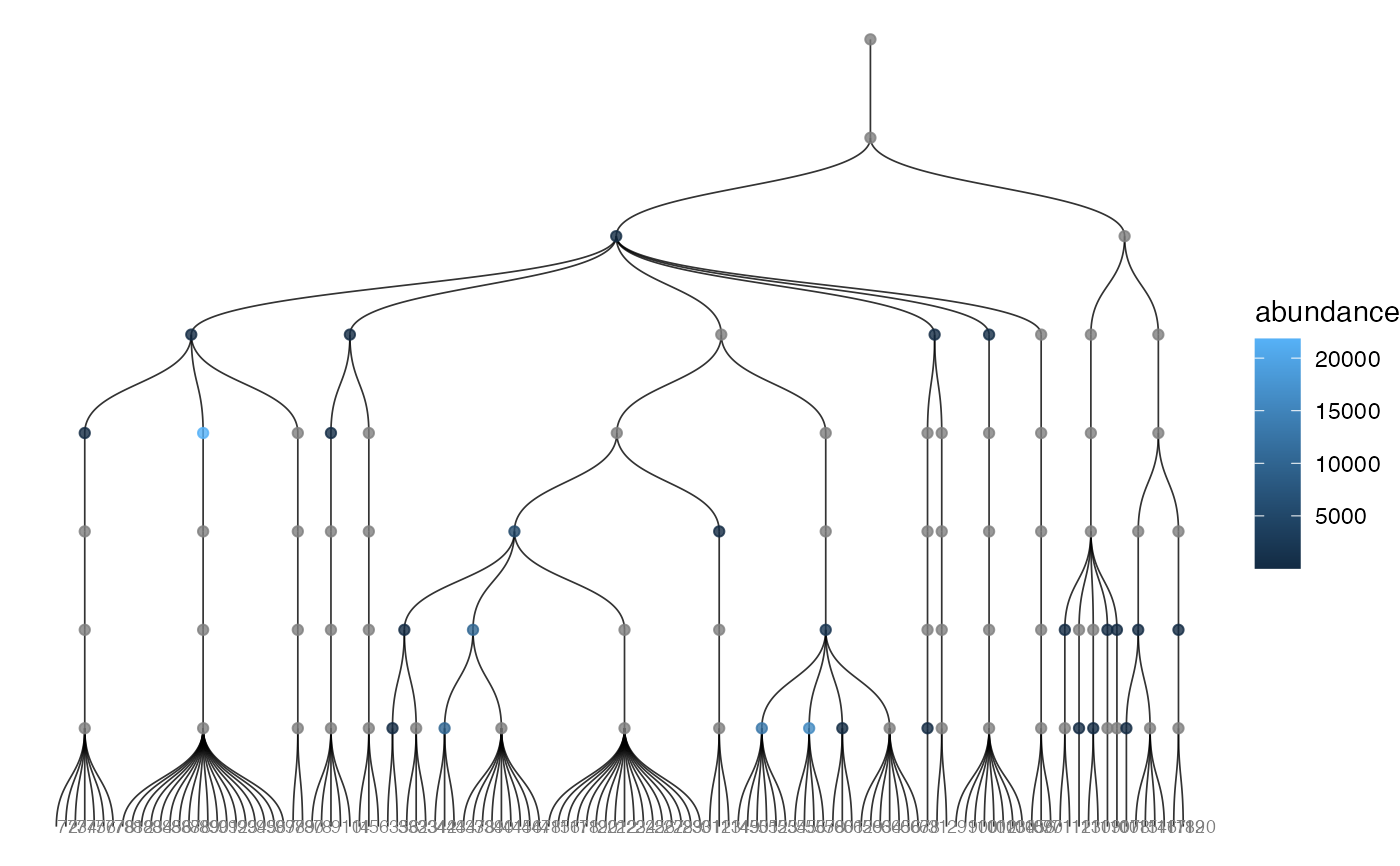
Thin wrapper around plot_tree() with abundance mapping enabled.
Arguments
- object
A
microbiome_datasetobject.- tree
Tree slot to plot, either
"otu_tree"or"taxa_tree".- layout
Graph layout passed to
ggraph::ggraph().- use_link
Should explicit
*_tree_linkmetadata be used before falling back to label-based matching? Defaults toTRUE.- abundance_method
Summary used when
abundanceis mapped onto nodes.- taxonomic_rank
Taxonomic rank used when mapping abundance onto
taxa_tree. Ignored forotu_tree.- show_tip_label
Should tip labels be drawn? Defaults to
TRUE.- tip_label_size
Text size for tip labels.
Examples
data("global_patterns", package = "microbiomedataset")
x <- prune_taxa(global_patterns, variable_id = global_patterns@variable_info$variable_id[1:120])
x <- align_tree(x, tree = "taxa_tree")
plot_tree_abundance(x, tree = "taxa_tree", taxonomic_rank = "Phylum")
#> Warning: Ignoring empty aesthetic: `size`.