Draw a heatmap ordered by the tip order of taxa_tree or otu_tree.
Usage
plot_tree_heatmap(
  object,
  tree = c("otu_tree", "taxa_tree"),
  taxonomic_rank = c("Kingdom", "Phylum", "Class", "Order", "Family", "Genus", "Species"),
  top_n = 20,
  relative = TRUE
)
Arguments
- object
A microbiome_dataset object.
- tree
Tree slot used to derive row order.
- taxonomic_rank
Taxonomic rank used when tree = "taxa_tree".
- top_n
Number of rows displayed when tree = "taxa_tree".
- relative
Whether to use relative abundance.
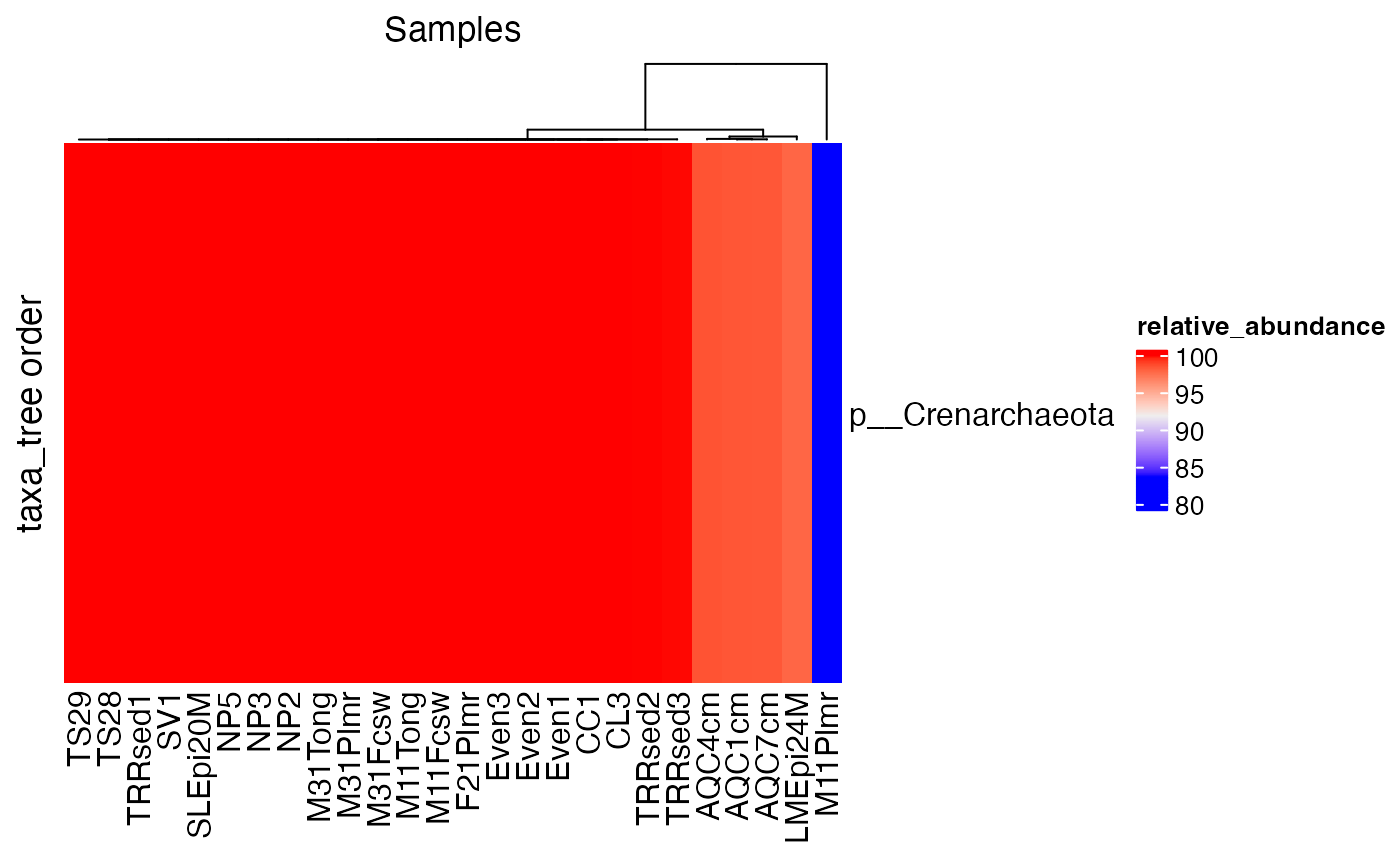
Examples
data("global_patterns", package = "microbiomedataset")
x <- prune_taxa(global_patterns, variable_id = global_patterns@variable_info$variable_id[1:120])
x <- align_tree(x, tree = "taxa_tree")
plot_tree_heatmap(x, tree = "taxa_tree", taxonomic_rank = "Phylum")