Plot Longitudinal Taxa Trajectories
Source:R/plot_microbiome_visualization_extended.R
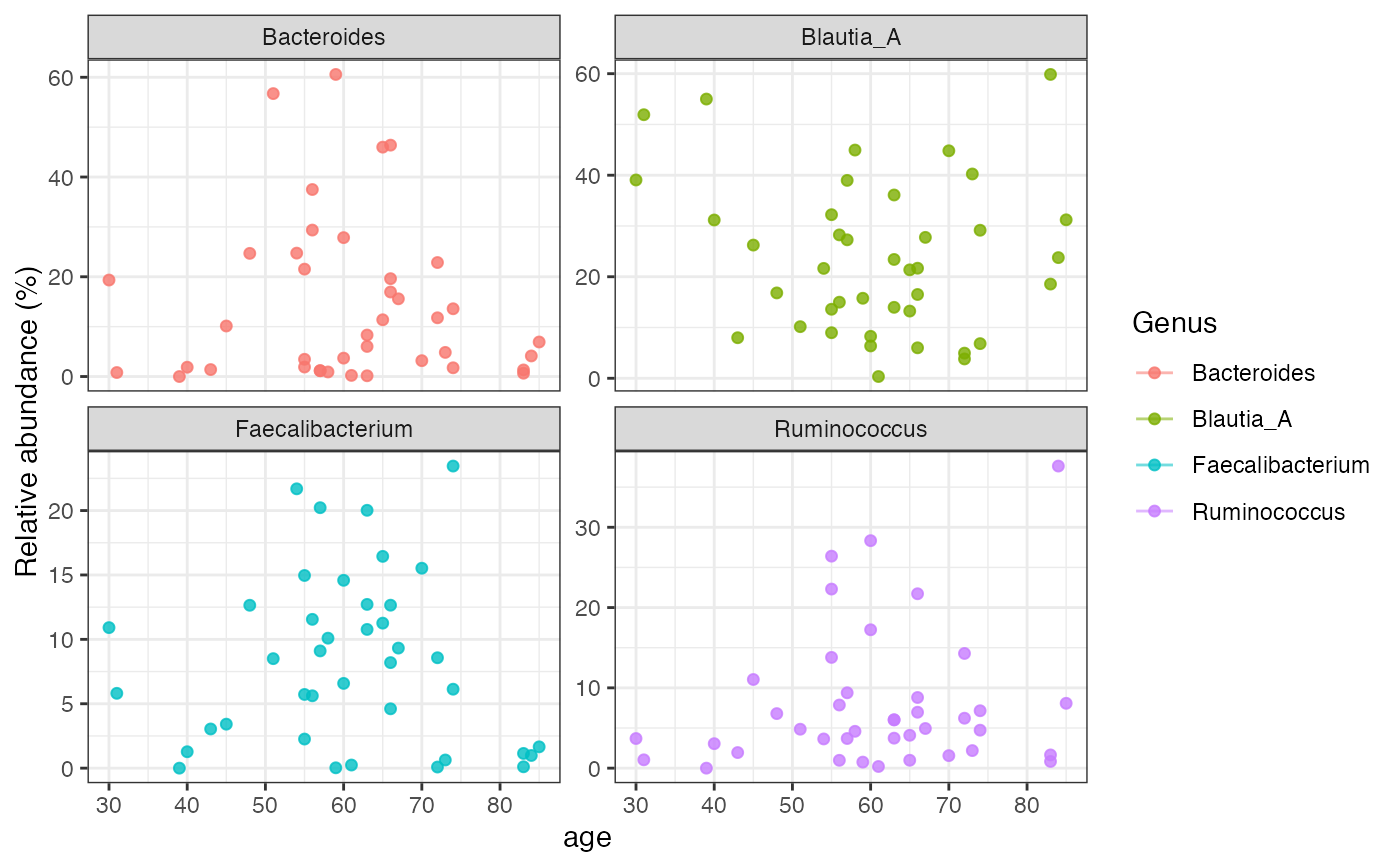
time_series_taxa_plot.RdPlot selected taxa across an ordered sample metadata variable.
Usage
plot_longitudinal(
  object,
  taxonomic_rank = c("Kingdom", "Phylum", "Class", "Order", "Family", "Genus", "Species"),
  time_by,
  id_by = NULL,
  color_by = NULL,
  taxa = NULL,
  top_n = 6,
  relative = TRUE
)
Arguments
- object
A
microbiome_datasetobject.- taxonomic_rank
Taxonomic rank used for aggregation.
- time_by
Sample metadata column used on the x axis.
- id_by
Optional metadata column used to connect repeated measures.
- color_by
Optional metadata column used for color.
- taxa
Optional taxa labels.
- top_n
Number of taxa shown when
taxais omitted.- relative
Whether to use relative abundance.
Examples
data("demo_crossomics", package = "microbiomedataset")
plot_longitudinal(
  demo_crossomics$microbiome_data,
  taxonomic_rank = "Genus",
  time_by = "age",
  id_by = "subject_id",
  top_n = 4
)
#> `geom_line()`: Each group consists of only one observation.
#> ℹ Do you need to adjust the group aesthetic?
#> `geom_line()`: Each group consists of only one observation.
#> ℹ Do you need to adjust the group aesthetic?
#> `geom_line()`: Each group consists of only one observation.
#> ℹ Do you need to adjust the group aesthetic?
#> `geom_line()`: Each group consists of only one observation.
#> ℹ Do you need to adjust the group aesthetic?