Thin wrapper around plot_abundance() with geom = "violin".
Usage
plot_taxa_violin(
  object,
  taxonomic_rank = c("Kingdom", "Phylum", "Class", "Order", "Family", "Genus", "Species"),
  taxa = NULL,
  top_n = 10,
  x = "sample_id",
  relative = TRUE
)Examples
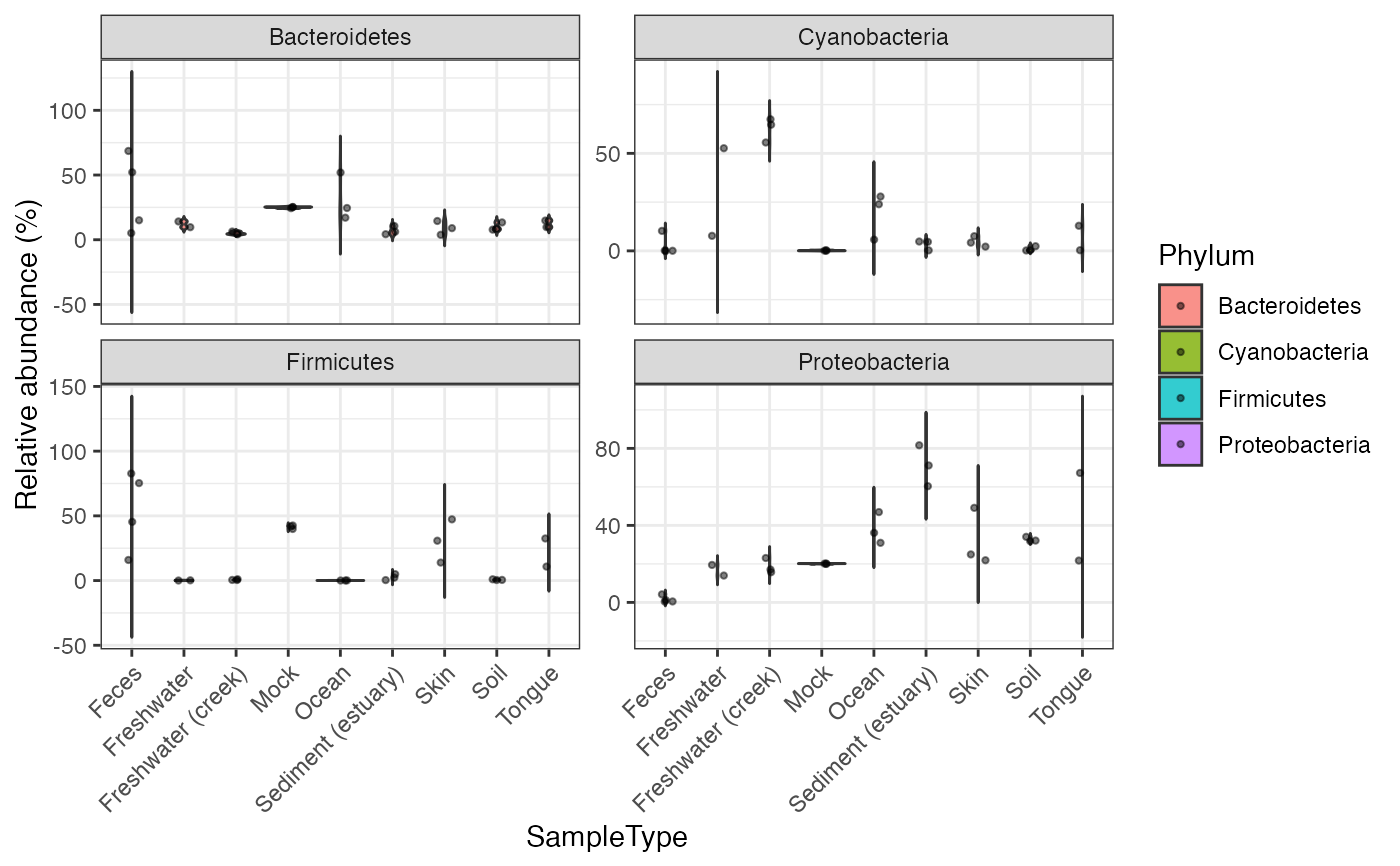
data("global_patterns", package = "microbiomedataset")
plot_taxa_violin(global_patterns, taxonomic_rank = "Phylum", x = "SampleType", top_n = 4)
#> Ignoring unknown labels:
#> • colour : "Phylum"